The Definite Integral
If a function is continuous over some defined interval, it is said to be integrable, because we can find its definite integral. But what exactly is a definite integral? Well, suppose we have a continuous function ƒ(x) defined on an interval [a, b]. We can informally define the definite integral as the signed area of the region bounded by the graph of ƒ(x), the x axis, and the vertical lines intersecting the x axis at a and b. The area of any part of the region above the x axis is positive, while the area of any part of the region below the x axis is negative. The definite integral is the net area between a function and the x axis. But how do we find the exact area?
There are various methods we could use to get an approximation of the area. The illustration below shows the function ƒ(x) = x 2 defined on the interval [0, 1]. The region under the curve is divided into eight subintervals of equal width. The rectangles that we see inscribed within each subinterval have the same width as the subinterval, and a height equal to the smallest value taken by ƒ(x) over the subinterval.
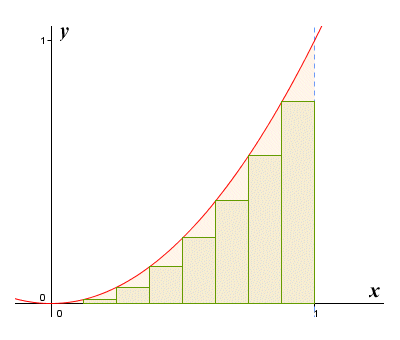
Approximating the area under ƒ(x) = x 2 for 0 ≤ x ≤ 1 using inscribed rectangles
If we add together the areas of the rectangles, we will get the left end point approximation for the area of the region under the curve (so called because each rectangle is drawn so that its top left-hand corner lies on the curve of the graph). Because the function is increasing over the interval, none of the rectangles cover the entire region under the graph contained within their subinterval. The approximation will therefore be an underestimate of the actual area. Suppose, for the sake of comparison, we make another approximation using rectangles. Everything will be exactly the same, except that this time we'll make the height of the rectangle drawn within each subinterval equal to the largest value taken by ƒ(x) over the subinterval.
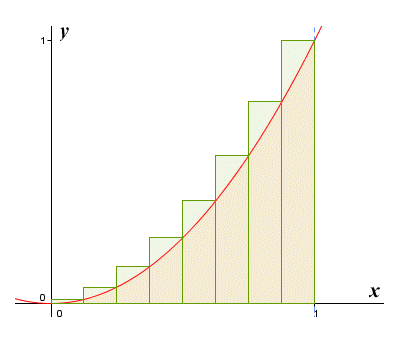
Approximating the area under ƒ(x) = x 2 for 0 ≤ x ≤ 1 using circumscribed rectangles
This time, when we add together the areas of the rectangles, we get the right end point approximation for the area of the region under the curve (so called because each rectangle is drawn so that its top right-hand corner lies on the curve of the graph). Because the function is increasing over the interval, all of the rectangles cover the entire region under the graph contained within their subinterval, plus a small portion of the space above the graph. The approximation will therefore be an overestimate of the actual area.
With both of these approximations, increasing the number of subintervals will give us a more accurate result. When our approximation produces an over estimate of the area under the graph, we call it an upper Riemann sum. When an under estimate is produced, we call it a lower Riemann sum. If we keep increasing the number of subintervals used, the upper and lower Riemann sums get closer and closer together, as they approach the same limit. This limit is of course the actual area under the curve, sometimes called the Riemann integral. We will use the term definite integral here (note that there is also such a thing as the indefinite integral, but we will talk about that elsewhere in this section).
The concept of integration is based on the idea that, if we had an infinite number of rectangles, each of infinitesimal width, then adding together the areas of those rectangles would give us the exact area under the graph. We can express this idea quite concisely using the following mathematical notation:
| ∫ | b | ƒ(x) dx |
| a |
In case you are unfamiliar with the notation used here, we'll briefly explain what it means. The strange-looking symbol at the beginning is the integration symbol. It is based on the long 's' character, which is often mistaken for an 'f', and which can often be found in very old texts (for example, in the United States Bill of Rights, where it appears in the word "Congress"). This letter was chosen by the German mathematician Gottfried Wilhelm Leibniz (1646-1716) to represent integration, because he thought of the integral as an infinite sum.
The subscripted and superscripted characters a and b immediately to the right of the integration symbol represent the lower and upper bounds respectively of the interval over which the function is defined, and over which we are integrating. This interval is also known as the domain of integration, with a as the lower limit of integration and b as the upper limit of integration. Next, we see the expression to be integrated - in this case the function ƒ(x) - which we call the integrand (the integrand is usually, though not always, a function). Last but not least we have the term dx, which tells us that we are integrating over x, which we refer to as the variable of integration. It can also be seen as representing an infinitesimally small increment of x.
Let's take things a step further. Suppose we have a continuous function ƒ(x) defined on the interval [a, b]. We will divide the interval into n subintervals of equal width. We'll call the width of each subinterval Δx, and we will use the letter i as an index when referring to a particular sub interval. Within each subinterval, we choose a distinguished point on the x axis, which we'll label xi*. The value of ƒ(xi* ) will give us the height of the rectangle for each subinterval. The area of the rectangle within a given subinterval will therefore be:
ƒ(xi* ) Δx
The Riemann sum (which we get by adding together the areas of the rectangles in all of the subintervals) will thus be:
| S = | n | ƒ(xi* ) Δx |
| Σ | ||
| i = 1 |
However, the ultimate goal of integration is to get away from this idea of adding together the areas of a finite number of rectangles. Instead, we should be thinking about the sum of an infinite number of rectangles of infinitesimal width. To that end, we can express the definite integral of ƒ(x) over the interval [a, b] as:
|
|
The definite integral (or Riemann interval) is thus the limit of the sum of ƒ(xi * ) Δx for i = 1 to n, as n tends to infinity and Δx tends to zero. Note that the question of choosing a distinguished point within each interval at which to evaluate ƒ(x) becomes somewhat redundant, since Δx tends to zero anyway. All of which is all very interesting, of course, but we still need to be able to find the indefinite integral without having to calculate, and sum together, an infinite number of terms! Let's have a look at how we might do this. We'll start off by looking at a somewhat trivial example. The illustration below shows the graph of the function ƒ(x) = x for 0 ≤ x ≤ 1.
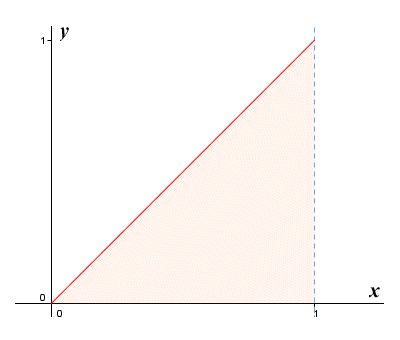
The graph of the function ƒ(x) = x for 0 ≤ x ≤ 1
Obviously, we can easily find the area under the graph in this case, since it will simply be the area of a right-angled triangle in which both legs are one unit in length. We are going to ignore that minor detail, however, and instead apply what we have learnt so far about the definite integral. Let's suppose that we are going to subdivide the interval [0, 1] into n subintervals. The width of each subinterval will therefore be given by:
| Δx = | 1 - 0 | = | 1 |
| n | n |
Although the choice of distinguished point within each subinterval is essentially unimportant, let's assume for the sake of argument that we are calculating a right-handed Riemann sum. The values of x taken by ƒ(x) in each subinterval will therefore be:
| xi * = iΔx = i | 1 | = | i |
| n | n |
We can now formulate our Riemann sum:
| S = | n | ƒ(xi) Δx = | n | i | · | 1 | = | 1 | n | i |
| Σ | Σ | Σ | ||||||||
| n | n | n 2 | ||||||||
| i = 1 | i = 1 | i = 1 |
Note that the last term in our Riemann sum is now simply the sum of consecutive integers, for which there is a well-known formula:
| n | i = | n (n + 1) |
| Σ | ||
| 2 | ||
| i = 1 |
If we substitute this expression into our Riemann sum, we get:
| S = | 1 | · | n (n + 1) | = | n + 1 |
| n 2 | 2 | 2n |
So the definite integral of ƒ(x) = x for 0 ≤ x ≤ 1, if we take the limit as n tends to infinity, is:
| ∫ | 1 | ƒ(x) dx = | lim | n + 1 | = | 1 | |
| 0 | n→∞ | 2n | 2 |
We could of course have arrived at the same answer by calculating the area of the triangular region under the graph (base multiplied by height, all over two), but we wanted to demonstrate a point, which is that the definite integral can be calculated algebraically as the limit of a Riemann sum. In order to persuade ourselves that this will work for non-linear functions as well, let's look at another example. This time we'll find the area under the graph of the function ƒ(x) = x 2 for 0 ≤ x ≤ 2. The graph is shown below.
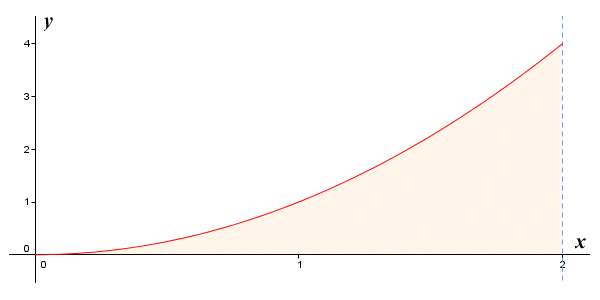
The graph of the function ƒ(x) = x 2 for 0 ≤ x ≤ 2
As before, we are going to subdivide the interval [0, 2] into n subintervals, so the width of each subinterval is given by:
| Δx = | 2 - 0 | = | 2 |
| n | n |
Once again, although the choice of distinguished point within each subinterval is unimportant, let's assume that we are calculating a right-handed Riemann sum. The values of x taken by ƒ(x) in each subinterval will therefore be:
| xi * = iΔx = i | 2 | = | 2i |
| n | n |
Our Riemann sum will be as follows:
| S = | n | ƒ(xi) Δx = | n | ( | 2i | ) | 2 | · | 2 | = | 8 | n | i 2 |
| Σ | Σ | Σ | |||||||||||
| n | n | n 3 | |||||||||||
| i = 1 | i = 1 | i = 1 |
The last term in our Riemann sum is now the sum of the squares of consecutive integers. Just as there is a well-known formula for the sum of consecutive integers, there is also a well-known formula for the sum of the squares of consecutive integers:
| n | i 2 = | n (n + 1) (2n + 1) |
| Σ | ||
| 6 | ||
| i = 1 |
If we substitute this expression into our Riemann sum, we get:
| S = | 8 | · | n (n + 1) (2n + 1) | = | 8n 2 + 12n + 4 |
| n 3 | 6 | 3n 2 |
So the definite integral of ƒ(x) for 0 ≤ x ≤ 2, if we take the limit as n tends to infinity, is:
| ∫ | 2 | ƒ(x) dx = | lim | 8n 2 + 12n + 4 | = | 8 | |
| 0 | n→∞ | 3n 2 | 3 |
This is the correct answer, and we have now demonstrated that it is possible to calculate the area under the graph of a non-linear function algebraically. In case you still need convincing, let's try one more example. This time we'll find the area under the graph of the function ƒ(x) = x 3 + 1 for 0 ≤ x ≤ 1. The graph is shown below.
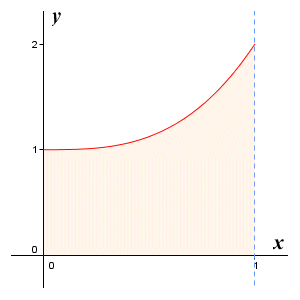
The graph of the function ƒ(x) = x 3 + 1 for 0 ≤ x ≤ 1
As with the previous examples, we'll subdivide the interval [0, 1] into n subintervals, so the width of each subinterval is given by:
| Δx = | 1 - 0 | = | 1 |
| n | n |
Although we have pretty much established that the choice of distinguished point within each subinterval is unimportant, we will assume that we are calculating a right-handed Riemann sum. The values of x taken by ƒ(x) in each subinterval will therefore be:
| xi * = iΔx = i | 1 | = | i |
| n | n |
Our Riemann sum is formulated as follows:
| S = | n | ƒ(xi) Δx = | n | (( | i | ) | 3 | + 1 | ) | · | 1 | = | 1 | n | i 3 |
| Σ | Σ | Σ | |||||||||||||
| n | n | n 4 | |||||||||||||
| i = 1 | i = 1 | i = 1 |
We now have a term in the Riemann sum that is the sum of consecutive integers cubed (i.e. raised to the power of three). Fortunately for us, there is also a (maybe not quite so well-known) formula for the sum of consecutive powers of three:
| n | i 3 = | n 2 (n + 1) 2 |
| Σ | ||
| 4 | ||
| i = 1 |
If we substitute this expression into our Riemann sum, we get:
| S = | 1 | · | n 2 (n + 1) 2 | + 1 = | (n + 1) 2 | + 1 |
| n 4 | 4 | 4n 2 |
So the definite integral of ƒ(x) = x 3 + 1 for 0 ≤ x ≤ 1, if we take the limit as n tends to infinity, is:
| ∫ | 1 | ƒ(x) dx = | lim | 4n 2 + (n + 1) 2 | = | 5 | |
| 0 | n→∞ | 4n 2 | 4 |
Once again, we can confirm that this is the correct answer. We now know that it is at least possible to calculate the area under the graph of a non-linear function algebraically, but the way we have been doing it seems like an awful lot of work. In fact, we have been fortunate with the examples shown in the sense that, in each case, there was a handy summation formula available that we could plug in to our calculation to make life easier. This will not always be the case - most of the time we need to work a lot harder to solve integral calculus problems algebraically.
You are probably thinking that there must be an easier way to find integrals, and there is. There are a number of relatively simple rules for carrying out integration that can save us a lot of work once we learn how to apply them. Using these rules, it is possible find the integral of an integrable non-linear function without jumping through too many hoops. Be advised, however, that a basic knowledge of differential calculus is required if you want to properly understand the rules of integral calculus. If you have not already done so, you might want to read (or at least review) the relevant pages in the Differential Calculus section of this website.