| Author: | |
| Website: | |
| Page title: | |
| URL: | |
| Published: | |
| Last revised: | |
| Accessed: |
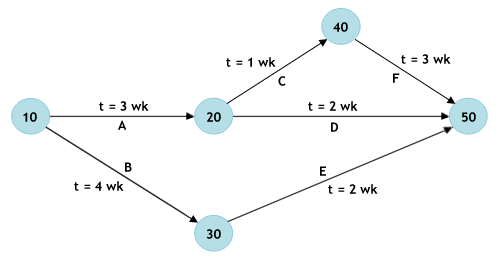
CPM uses a fixed time estimate for each project activity. While easy to understand and use, it does not take account of the time variations that can impact on the completion time of a complex project. The Program Evaluation and Review Technique (PERT) is a network model that allows for variations in activity completion times. In a PERT network model, each activity is represented by a line (or arc), and each milestone (i.e. the completion of an activity) is represented by a node. A simple example is shown below.

A simple PERT network
Milestones are numbered so that the end node of an activity has a higher number than the start node. Incrementing the numbers by 10 allows for additional nodes to be inserted without modifying the numbering of the entire network. The activities are labelled alphabetically, and the expected time required for each activity is also indicated. The critical path is the pathway through the project network that takes the longest to complete, and will determine the overall time required to complete the project. Bear in mind that for a complex project with many activities and task dependencies, there can be more than one critical path through the network, and that the critical path can change.
PERT planning involves the following steps:
Because the critical path determines the completion date of the project, the project can be completed earlier by allocating additional resources to the activities on the critical path. PERT also identifies activities that have slack time, and which can therefore lend resources to critical path activities. One drawback of the model is that if there is little experience in performing an activity, the activity time estimate may simply be a guess. Another more serious problem is that, because another path may become the critical path if one or more of its associated activities are delayed, PERT often tends to underestimate the to time required to complete the project.
PERT incorporates uncertainty by making it possible to schedule a project while not knowing precise details and durations of all activities. The time shown for each project activity when creating the network diagram is the time that the task is expected to take based on a range of possibilities that can be defined as:
The expected time (the time that will appear on the network diagram) is defined as the average time the task would require if it were repeated a number of times over a period of time, and can be calculated using the following formula:
expected time = (optimistic time + (4 x most likely time) + pessimistic time) / 6
The information included on the network diagram for each activity may include:
In order to determine these parameters, the project activities must have been identified and the expected duration of each calculated. The earliest start (ES) for any activity will depend on the maximum earliest finish (EF) of all predecessor activities (unless the activity is the first activity, in which case the ES is zero). The earliest finish for the activity is the earliest start plus the expected duration. The latest start (LS) for an activity will be equal to the maximum earliest finish of all predecessor activities. The latest finish (LF) is the latest start plus the expected duration. The slack in any activity is defined as the difference between the earliest finish and the latest finish, and represents the amount of time that a task could be delayed without causing a delay in subsequent tasks or the project completion date. Activities on the critical path by definition have zero slack.
A PERT chart provides a realistic estimate of the time required to complete a project, identifies the activities on the critical path, and makes dependencies (precedence relationships) visible. It can also identify the earliest and latest start and finish dates for a task, and any slack available. Resources can thus be diverted from non-critical activities to those that lie on the critical path should the need arise, in order to prevent project slippage. Variance in the project completion time can be calculated by summing the variances in the completion times of the activities in the critical path, allowing the probability of the project being completed by a certain date to be determined (this will depend on the number of activities in the critical path being great enough to allow a meaningful normal distribution to be derived).PERT charts can become unwieldy, however, if the number of tasks is too great. The accuracy of the task duration estimates will also depend on the experience and judgment of the individual or group that make them.