| Author: | |
| Website: | |
| Page title: | |
| URL: | |
| Published: | |
| Last revised: | |
| Accessed: |
Object-Oriented Analysis and Design (OOAD) is a software development approach that models a system as a group of objects. Each object represents some real world entity within the system being modeled, and has its own attributes and operations. A range of models can be created using such objects to reflect the structure and behaviour of the system. One of the most widely used notations for depicting objects and the way they interact with each other is the Unified Modeling Language (UML). UML was adopted by the Object Management Group (OMG) in 1997 as the standard for object-oriented modelling, and combines widely accepted concepts from a number of object-oriented modelling techniques.
The line between analysis and design in OOAD is indistinct, but essentially object modelling is used to determine the functional requirements of a system (i.e. what the system must do) during the analysis phase, and the models thus derived are refined and augmented to produce a blueprint for the physical implementation (i.e. how the system will do what it must do) during the design phase.
The information fed into the analysis stage is derived by all the usual means, such as written requirements statements, interviews, observation, and a study of the system's documentation. The various diagrams produced during the analysis and design stages are easy to understand, and can be used to explain aspects of the proposed system design to users, and obtain feedback. The final set of design-phase diagrams reflect the chosen physical architecture, and take into consideration any constraints associated with the environment in which the system must operate, or the technical options available. They will be developed in sufficient detail to provide the necessary input to the implementation phase.
Any discussion of object-oriented analysis and design rests on a good understanding of what objects and classes are, and the relationship between them. Essentially, an object is an abstract representation of some real world entity, such as a person or a bank account. It will hold data items (attributes) about the entity (for example name or account number). It will define operations (or methods) to report the values held by attributes, or modify them in some way. The operations defined for a class provide it with an interface through wich it can communicate with other objects. The object will be identified by a unique name. A class is a template that defines the attributes and operations that are common to the objects created from it. Looking at this from a different perspective, an object is an instance (a specific example) of a class. These ideas are common to both the object modelling notations used to analyse and design systems, and the object-oriented programming languages (such as C++ and Java) used to implement those systems.
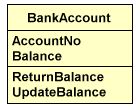
A simple bank account class
The simple bank account class shown above is represented by a rectangle divided into three sections. The class name, "BankAccount", appears in the top section of the rectangle. The middle section contains the attributes for the class, "AccountNo" and "Balance", and the bottom section contains two operations, "ReturnBalance" and "UpdateBalance". This is the general format in which the Unified Modelling Language represents a class. As the analysis process continues, additional attributes and operations may emerge and be added to the model.
Specialised classes can be derived from more generic classes. A "student" class, for example, would have the same general attributes (e.g. "name") as a "person" class, but would have additional attributes such as "student_number", and additional operations to manipulate those attributes. The idea of one class (a child class or subclass) deriving attributes and operations from another class (a parent class or superclass) is called inheritance. Inheritance is seen as a way of encouraging the re-use of code during the implementation phase, since existing attributes and operations are passed down from parent to child without needing to be explicitly redefined for the new (derived) class.
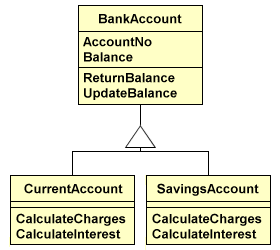
A class diagram illustrating inheritance
In the class diagram shown above, the triangle symbol indicates inheritance, with the apex of the triangle pointing towards the class from which operations and attributes are inherited. The "CurrentAcccount" and "SavingsAccount" classes inherit the operations and attributes of the "BankAccount" class, so these operations and attributes, although not shown, are implicit within these classes. Note that we have added the operations "CalculateCharges" and "CalculateInterest" to both sub-classes. These operations could have been included in the "BankAccount" class and inherited, but there is reason to suppose that the implementation of the operations will be different for different types of account. In fact, one of the benefits of the modelling approach is that we can explore the various ways in which functionality can be implemented before we write any code. If we decide later that the "CalculateInterest" operation, for example, will be identical for all types of account, we can change the model to reflect this.
Modelling languages like UML provide a way to create a model of a system that can be understood by both system developers and users, and can form the basis for an ongoing dialogue between these two groups of people. Everything within the system of interest is described in terms of objects, the properties of those objects, how objects can act and be acted upon, and the relationships that exist between objects. The models themselves consist primarily of diagrams, and the various types of diagram used employ a consistent notation throughout to maintain clarity. The aspects of a system that can be represented diagrammatically include its structure, which for the most part is relatively static, and its behaviour, which is dynamic and often complex.
The analysis phase looks at the existing system using a fairly high level of abstraction to determine the requirements of the system to be developed, without considering how those requirements will be implemented. It usually starts with a process of identifying objects within the system of interest, their attributes, and the relationships between them. One way of achieving this is to examine existing system documentation, such as invoices or purchase orders, and pick out the nouns used (e.g. "customer", "supplier", "account"). Suitable candidates will be chosen from the list to be modelled as classes using a class diagram of the type we have already seen. Here is a slightly more developed model of our simple bank system:
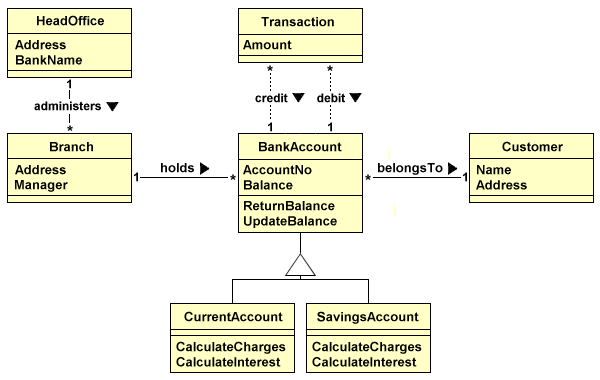
The banking system model
We have now added four more classes to the model, and have created a number of new relationships. These new classes and relationships are described below:
Class diagrams depict the structure of a system. They identify the classes used by the system, and define the attributes of each class, the operations they can perform, and the dependencies and relationships that exist between them. The class diagrams derived for the system will continually evolve throughout the analysis and design process as the requirements of the system become more clearly understood. The task of translating class diagrams into code is greatly facilitated by the use of an object-oriented programming language such as C++ or Java. Solid lines depict an association, whereas dashed lines depict a dependency.
Other types of UML diagram used to represent the structure of the system include:
The behaviour of the system is modelled dynamically. You can think of it in terms of creating a series of stories, each of which describes some aspect of how objects behave and how they interact with one another. A number of diagramming techniques are provided by UML to model the events that occur within the system, what actors are responsible for instigating them, and the actions that they trigger. We are interested in the interactions between objects, the transitions that occur, and the sequencing of events. Modelling these dynamic characteristics can often uncover additional system requirements, and result in further refinement of the system's logical or physical architecture models.
Use-case diagrams model the system's functions from the perspective of various actors. An actor is an external entity that makes use of the system in one or more ways. The actor is usually a person, but may be an organisation or another computer system. Actors may also (though not necessarily) be represented within the system by a class. The use-case models how an actor uses the system in one particular way, and the functionality provided by the system for that situation. A use-case may involve more than one actor, and an actor may be involved in a number of use-cases (though often not at the same time). Actors are represented diagrammatically by stick men, while the use-cases they relate to are represented by an ellipse, as shown below.

A simple use-case diagram
A use-case is an abstract view of the services provided by the system to the actors that use it. It does not specify how those services are provided. Use-cases are used in the analysis phase to determine the system requirements. As the requirements become clearer, the object model is updated in parallel, to ensure that all the necessary classes, attributes, operations, dependencies and relationships are in place. Essentially, each use-case in a system represents one way in which one actor interacts with the system. The more actors there are, and the more ways in which each actor can interact with the system, the more use cases will need to be considered.
The use-case diagram below illustrates some of the business functions that might be required by our bank system. It shows, for example, that customers may use the system to make deposits or withdrawals, check their balance, or take out a loan. Cashiers may be involved with deposits or withdrawals, and in the case of the latter, will need to check the account balance to ensure sufficient funds are available. In both cases, they will need to update the account balance. Managers may be involved in arranging loans for customers.
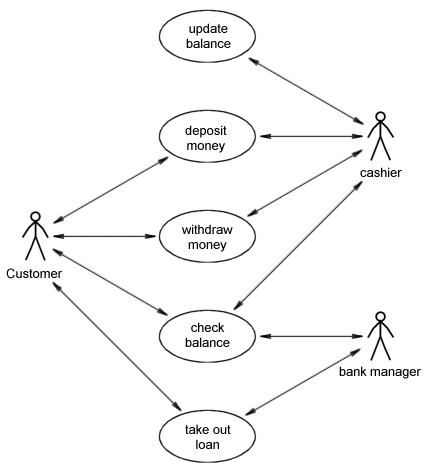
A use-case diagram for a simple bank system
Use-cases can be used to break a system down into atomic business functions that can be used both as units for costing, or for planning a phased system delivery. Each phase of delivery would deliver a number of use-cases. A scenario is a specific sequence of actions that represents a single instance of a use-case. For example, in a real banking system a customer may withdraw cash from an ATM, over the counter in the bank, or as cash-back from a shop or supermarket. For that matter, many banking transactions such as paying bills, transferring of funds, or setting up direct debits and standing orders can now be carried out using online banking services, so for a real banking system, there would be a great many scenarios we might need to consider.
A use-case diagram is often accompanied by a brief textual description for each use case shown. For example, the withdraw cash use-case might be described as:
A customer uses the system to withdraw a specified sum of money from a specified account.
The use-case is often also accompanied by a set of formally documented requirements, scenarios, and constraints. Requirements are specified in terms of the functionality that the use-case will provide, the inputs to the use-case, and the outputs from the use-case. Scenarios are formal descriptions of the flow of events during execution of an instance of a use-case, and are directly related to sequence diagrams (see below). Constraints are restrictions imposed on the occurrence of a use-case, and specify what pre-conditions must be true before the use-case can proceed, what post-conditions must be true following the execution of the use case, and what invariant conditions must be true during the execution of the use case.
Other types of UML diagram used to represent the behaviour of the system include:
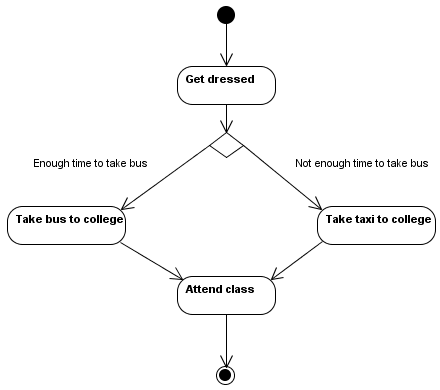
An activity diagram is a bit like a flowchart for a computer program, but in this case it represents activities within a system, and the events that cause objects to be in a particular state. The following simple activity diagram illustrates what might be involved in a student attending college for a class at 9 a.m.
A simple activity diagram
The first activity is to get dressed. A decision then has to be made, depending on how much time is available before the class begins and the times of local buses. If there is enough time to get to college by bus, take the bus. If not, take a taxi. The last activity is to actually attend the class, after which the activity diagram terminates. The diagram commences at the initial node (drawn as a solid black circle), and ends at the terminating node (drawn as a bull's eye). Activities are drawn as rounded rectangles containing a brief description of the activity. A decision node is shown as a diamond, with arrows emerging from it to represent the alternative control flows. Each alternative is labelled to show the options that determine which flow is followed.
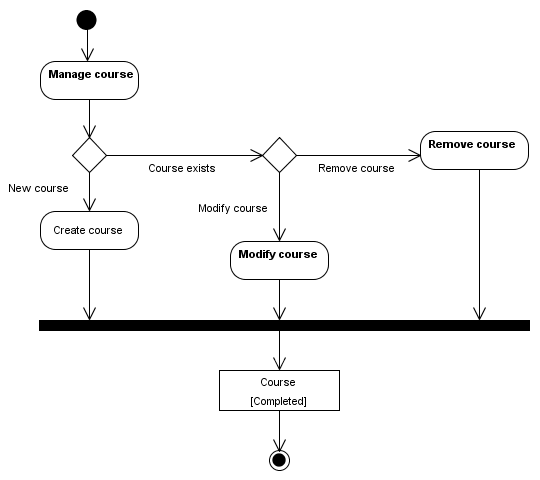
Now we will look at another example that deals with the activity of managing course information in a courseware management system (such as Moodle, for example). In order to manage course information, the course administrator carries out the following activities:
A more complex activity diagram
Note the fork node, represented by the heavy black line. Fork nodes are used to either split a workflow into multiple concurrent flows, or (as in this case) combine multiple concurrent flows. The "Course" object is included in the activity diagram, since its state is affected by each of the activities shown.