| Author: | |
| Website: | |
| Page title: | |
| URL: | |
| Published: | |
| Last revised: | |
| Accessed: |
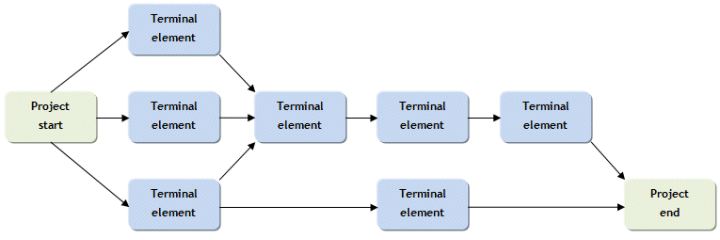
A project network (or project activity network) is a graphical depiction (very similar to a flow chart) that shows the sequence in which the project's terminal elements must be completed. Each terminal element represents an activity that relates to a work package at the lowest level of the work breakdown structure (WBS). However, whereas the WBS does not attempt to identify the sequence of events or the duration of any activity, the project network seeks to identify the sequence in which activities occur and the other activities (if any) on which a particular activity depends. There are a number of techniques used to create a project activity network. Some of the more commonly used techniques include Gantt charts, Critical Path Management (CPM) and the Project Evaluation and Review Technique (PERT). In some techniques, each terminal element (or activity) is represented by a node on a graph, while in others it is represented by an edge (the line connecting two nodes). Each terminal element should lie on only one path through the network. An example of a project activity network diagram is illustrated below.

A generic project activity network diagram
An activity network diagram helps you to determine the most logical sequence of events for a project, and provides the basis of a realistic project schedule. It will enable you to calculate the total amount of time required for the project, define the order in which tasks must be carried out, and highlight those tasks that are critical to the project schedule. When the WBS has been completed you will have a list of activities at various levels of decomposition that must be completed in order to achieve the project’s objectives. You can now determine the task dependencies and the duration of each task to allow a schedule to be produced. Project management software is now available that will carry out the scheduling for you, calculate the overall time required for completing the project, and identify the schedule's critical path. All you have to do is to enter the duration of each task and identify any task dependencies. The software will produce network activity charts and Gantt charts based on the information that you provide.
Although project management software is readily available these days it is useful to understand the process by which an activity network diagram is created. The following steps can be used to carry out the process manually:
The critical path tells you how long it will take to complete the entire project (based on current information). The tasks on the critical path, therefore, must be monitored more closely than those tasks not on the critical path, because any delays in one of these tasks will cause the critical path to increase in length (in other words, the time required to complete the project will increase). One way of reducing the overall duration of the project, of course, is to speed up the execution of one or more tasks on the critical path – assuming this is possible. For other paths through the network, each task will have some slack in the sense that it may be delayed – up to a point – because it is not on the critical path. Bear in mind however that should one or more tasks on other paths become significantly delayed, the path affected may acquire an overall duration that exceeds that of the critical path. It will therefore by definition become the new critical path.
Gantt charts, PERT and CPM are all useful techniques that provide information about project schedules in a graphical way, but they do not tell you everything. They do not tell you, for example, what resources are required for a particular task. Activity network diagrams are snapshots of the status of a project at a particular time. It will be necessary to update them as circumstances change. If a task is taking longer than expected, it may have an impact on the overall project schedule. The same is true for tasks that are completed ahead of schedule. The impact on resources will not be apparent from looking at the network diagram alone, and other tools and techniques must be used to determine where the peaks and troughs will arise in terms of the demand for critical project resources.