| Author: | |
| Website: | |
| Page title: | |
| URL: | |
| Published: | |
| Last revised: | |
| Accessed: |
Fermat's theorem is named after the French lawyer and amateur mathematician Pierre de Fermat (1601-1665), and is only one of several theorems named after him. Suppose that we have some function defined on an open interval. Fermat's theorem essentially says that every local extremum (i.e. local maximum or minimum) of the function that occurs at a point within the interval where the function is differentiable (i.e. the function has a derivative at that point) must be a stationary point. Remember that a stationary point is a special kind of critical point at which the function is neither increasing nor decreasing in value, so the derivative of the function at that point must be zero. Stating this slightly more formally:
If a function ƒ(x) is defined on the interval (a, b), and there exists a point on the interval for which x = c such that a < c < b, then if the point (c, ƒ(c)) is a local extremum and ƒ′(c) exists, then (c, ƒ(c)) must be a critical point of ƒ(x) such that ƒ′(c) = 0.
The theory does not say that every stationary point is a local extremum, or even that every local extremum must be a stationary point - a local extremum can also occur at a non-differentiable point (such as a discontinuity) within an interval. Such points are still critical points, just not stationary points. For now, however, we will ignore the issue of discontinuities. Consider the illustration below.

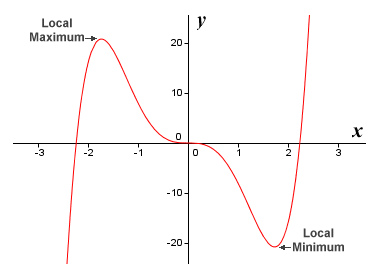
The graph of the function ƒ(x) = 2x 5 - 10x 3
You can see that the function ƒ(x) = 2x 5 - 10x 3 has three stationary points. The first occurs on the left-hand side of the x axis at x = -1.732 (or x = -√3) and is a local maximum. A second occurs on the right-hand side of the x axis at x = 1.732 (or x = √3), and is a local minimum. A third stationary point is found exactly half-way between these two points, at x = 0. This point cannot be a local maximum or minimum, because the function values are decreasing as they approach the point from the left, and continue to decrease as they move away from the point to the right.
If the slope of a function immediately to the left and right of a stationary point is the same, then the sign of the function derivative immediately to the left and right of the critical point will also be the same (remember that the derivative of a function at any point represents its slope at that point). We shall see in due course that in order for a function to have a local maximum or minimum at a stationary point, the derivative must change sign at the stationary point, either from positive to negative or from negative to positive. If the derivative is positive to the left of the stationary point and negative to the right, then the stationary point is a local maximum. If the derivative is negative to the left of the stationary point and positive to the right, then the stationary point is a local minimum.
The stationary point that occurs at x = 0 is an inflection point - it marks a change in the concavity of the function, but since the sign of the derivative to either side of the stationary point is the same, it is not a local extremum. Fermat's theorem is useful because it suggests a method for finding local extrema. The method involves finding all of the function's stationary points (or at least those that fall within some defined interval), and then checking the derivative to the left and right of each stationary point to determine whether it is a local maximum, a local minimum, or an inflection point. Here once more is the graph of the function ƒ(x) = 2x 5 - 10x 3, together with the graph of its first derivative function.

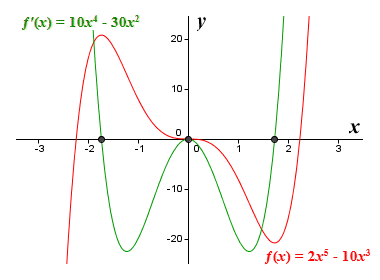
The graph of the functions ƒ(x) = 2x 5 - 10x 3 and ƒ′(x) = 10x 4 - 30x 2
The first derivative of the function ƒ(x) = 2x 5 - 10x 3 can be found relatively easily by applying the basic rules of differentiation, which gives us the function ƒ′(x) = 10x 4 - 30x 2. You can see that the points where the graph of this function cuts the x axis have the same x coordinates as the stationary points of the function ƒ(x) = 2x 5 - 10x 3. This should suggest to you a method for finding the stationary points of a function ƒ(x). Specifically, we need to obtain the first derivative function ƒ′(x), and then find its roots (or at least those that occur within the interval in which we are interested). For the example we have used above, we just need to solve the equation:
10x 4 - 30x 2 = 0
We can immediately factor out 10x 2:
10x 2(x 2 - 3) = 0
This means that either x 2 = 0 or x 2 - 3 = 0, which gives us possible values for x of zero, √3, or -√3. This agrees with the three values we identified previously for the x coordinates of the local extrema and the inflection point. As we have seen, once we find the stationary points of a function we can identify them as local maxima, minima, or inflection points by determining the sign of the function derivative to either side of the stationary point. This technique is known as the first derivative test. We will be looking at the first derivative test in more detail on a separate page.
If you have been really observant, you may have spotted something else interesting about the relationship between the graph of the function ƒ(x) = 2x 5 - 10x 3 and that of its derivative ƒ′(x) = 10x 4 - 30x 2. The graph of the function ƒ′(x) = 10x 4 - 30x 2 intercepts the x axis at the point corresponding to the local maximum of the function ƒ(x) = 2x 5 - 10x 3. Its slope (and therefore its derivative) at the intersection is negative. The graph also intersects the x axis at the point corresponding to the local minimum of the function ƒ(x) = 2x 5 - 10x 3. This time, its slope at the intersection is positive. Interestingly, where the function ƒ(x) = 2x 5 - 10x 3 has an inflection point (i.e. at x = 0), the graph of ƒ′(x) = 10x 4 - 30x 2 touches the x axis without intersecting it, which means that its slope at this point (i.e. its derivative) is zero.
You should by now be aware that the derivative of a derivative is called the second derivative. What you may not know yet (but might possibly have guessed), is that the sign of the second derivative (assuming it exists) for a value of x corresponding to a stationary point on a function can tell us something about the nature of the stationary point. A negative second derivative indicates a local maximum, a positive second derivative indicates a local minimum, and a second derivative of zero indicates an inflection point. Using the second derivative for this kind of analysis is called the second derivative test. We will be looking at the second derivative test in more detail on another page.