| Author: | |
| Website: | |
| Page title: | |
| URL: | |
| Published: | |
| Last revised: | |
| Accessed: |
If you have read the page entitled "The First Derivative Test", you will know that we can use the first derivative to determine whether a specific critical point on the graph of a function is a local maximum, a local minimum, or neither. We know that for a local maximum, the slope of a function (which is after all what the first derivative gives us) will be positive to the left of the local maximum (where the function is increasing in value), and negative to the right of the local maximum (where the function is decreasing in value). For a local minimum, the exact opposite occurs. The slope is decreasing to the left of the local minimum, and increasing to the right of the local minimum.
It's probably worth repeating our somewhat more formal statement describing the first derivative test. Suppose we have a function ƒ(x) that is continuous on the closed interval [a, b] and differentiable on the open interval (a, b), and that there exists a value c such that a < c < b and (c, ƒ(c)) is a critical point of the function ƒ(x):
If ƒ′(x) > 0 to the left of (c, ƒ(c)) and ƒ′(x) < 0 to the right of (c, ƒ(c)), then (c, ƒ(c)) is a local maximum.
If ƒ′(x) < 0 to the left of (c, ƒ(c)) and ƒ′(x) > 0 to the right of (c, ƒ(c)), then (c, ƒ(c)) is a local minimum.
If ƒ′(x) has the same sign on both the left and the right of (c, ƒ(c)), then (c, ƒ(c)) is neither a local maximum nor a local minimum.
Consider the illustration below. Here we see the graph of the polynomial function ƒ(x) = 2x 5 - 10x 3 and the graph of its first derivative function ƒ′(x) = 10x 4 - 30x 2. We can see that ƒ(x) has two local extrema, which occur where the graph of ƒ′(x) intersects the x axis. It also has an inflection point at x = 0, where the graph of ƒ′(x) touches the x axis at a single point, but does not intersect it. Since ƒ(x) is a polynomial function and is therefore "well behaved", we can find all of its critical points by solving ƒ′(x) = 0. We then just need to apply the first derivative test to each point to determine whether it is a local maximum, a local minimum, or neither.
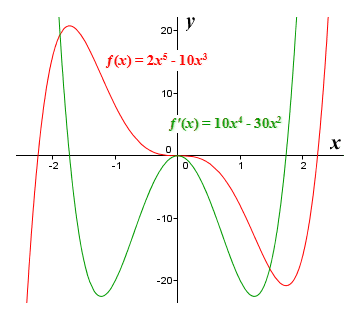
The graphs of ƒ(x) = 2x 5 - 10x 3 and ƒ′(x) = 10x 4 - 30x 2
So, we know that we can determine the nature of a critical point by checking the sign of the first derivative on either side of it. In order for the test to work, the function must be continuous over the defined interval. It must also be differentiable immediately to the left and right of the critical point to which the test is applied, although it is not necessary for the first derivative to exist at the critical point itself. If it does exist there, however, we may be able to more easily determine the nature of the critical point using the second derivative test.
As we shall see, the second derivative at a point on a curve can tell us something about the concavity of the curve at that point. In general terms, a curved line segment is said to be concave up if it forms all or part of a bowl shape, and concave down if it forms all or part of a dome shape. We can illustrate the point by looking at the graphs of the polynomial function ƒ(x) = 2x 5 - 10x 3 and its first derivative once more.
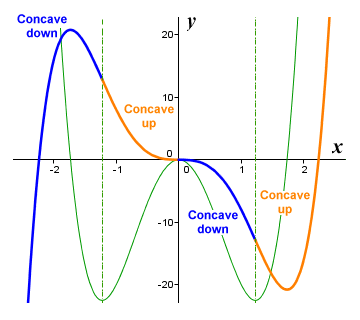
The graph of ƒ(x) = 2x 5 - 10x 3 has both concave up and concave down regions
Let's consider the relationship between the graph of the function itself and that of its first derivative. We can clearly see from the illustration above that, for those intervals over which the graph of the function is concave down, the value of the first derivative is decreasing as x increases. Conversely, for those intervals over which the graph of the function is concave up, the value of the first derivative is increasing as x increases. Furthermore, the points at which the concavity of the function changes from concave down to concave up both correspond to local minima on the graph of the first derivative. Similarly, the point at which the concavity of the function changes from concave up to concave down corresponds to a local maximum on the graph of the first derivative.
It might already have occurred to you that the second derivative of a function (which, remember, is simply the derivative of the first derivative of the function) must evaluate to zero at each local extremum of the first derivative. This is indeed the case. This means that, for any continuous, twice-differentiable function (note that not all functions can be differentiated twice), it would be reasonable to suppose that finding the zeros of the second derivative function will give us the x coordinates of the inflection points on the graph of our original function - i.e. the points at which its concavity changes from concave down to concave up, and vice versa. We present below the graph of the polynomial function ƒ(x) = 2x 5 - 10x 3 once final time, this time together with the graph of its second derivative function ƒ′′(x) = 40x 3 - 60x.
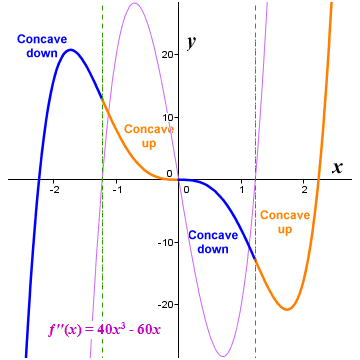
The graphs of ƒ(x) = 2x 5 - 10x 3 and ƒ′′(x) = 40x 3 - 60x
Like the first derivative, the second derivative can tell us something about what a function is doing at a given point. We have already seen that the second derivative will evaluate to zero for x values that correspond to inflection points (i.e. points at which the concavity of the graph of the function changes). We can also clearly see from the illustration above that, for intervals over which the function is concave down, the value of the second derivative is negative. For intervals over which the function is concave up, the value of the second derivative is positive.
We can use the second derivative, therefore, to tell us whether a function is concave up or concave down (or neither) at any point on the graph of the function - providing, of course, that the function is twice differentiable at that point. We can express this a little more formally (using what is sometimes referred to as the concavity theorem) as follows:
If a function ƒ(x) is twice differentiable at x = c, then the graph of ƒ(x) is concave up at (c, ƒ(c)) if ƒ′′(c) > 0, and concave down if ƒ′′(c) < 0.
If the second derivative is either zero or non-existent at a given point, the point may be an inflection point, but only if the concavity of the graph on either side of the point is different. There are situations in which the second derivative can evaluate to zero and yet not be an inflection point, as we can see if we look at the illustration below, which shows the graphs of the function ƒ(x) = x 4 and its second derivative ƒ′′(x) = 12x 2.
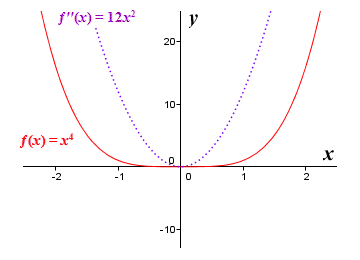
The graphs of ƒ(x) = x 4 and ƒ′′(x) = 12x 2
The function's second derivative evaluates to zero at x = 0, but the function itself does not have an inflection point here. In fact, x = 0 corresponds to a local minimum. The conditions under which the first and second derivatives can be used to identify an inflection point may be stated somewhat more formally, in what is sometimes referred to as the inflection point theorem, as follows:
If there exists a point on the graph of a function ƒ(x) for which x = c, where ƒ′(c) exists and ƒ′′(x) changes sign at x = c, then the point (c, ƒ(c)) is an inflection point on the graph of ƒ(x). If ƒ′′(c) exists at the inflection point, then ƒ′′(c) = 0.
We can test for inflection points using the second derivative in a manner similar to that in which we use the first derivative to test for local extrema. As we implied earlier, however, we can also use the second derivative to determine whether a critical point of a function is a local maximum or a local minimum. Assuming it can be used, the second derivative test provides a simpler alternative to the first derivative test. The main drawback is that it can only be used if certain criteria are met.
You may already have realised that being able to use the second derivative to determine the concavity of the graph of a function at a given point is what enables us to use it to identify a critical point on a function as being either a local maximum or a local minimum. If you think about it, it's fairly obvious that a local maximum must occur on a segment of the graph that is concave down (you can think of the local maximum as being at the top of a hill). Equally obvious is the fact that a local minimum must occur on a segment of the graph that is concave up (you can think of the local minimum as being at the bottom of a valley).
Having identified a stationary point on a function, all we need to do in order to determine whether it is a local maximum or a local minimum is to take the second derivative at that point. If it is positive, we have a local minimum, because the graph at that point is concave up. If it is negative, we have a local maximum, because the graph is concave down. Of course, if the second derivative evaluates to zero, we can draw no useful conclusions. In that case, we will have to try something else, but we'll come back to that shortly. We can describe the second derivative test in more formal terms:
For a function ƒ(x) that is twice differentiable at a stationary point for which x = c:
If ƒ′′(c) > 0, then ƒ(x) has a local minimum at x = c.
If ƒ′′(c) < 0, then ƒ(x) has a local maximum at x = c.
If ƒ′′(c) = 0, the test is inconclusive.
As we have already stated, there are certain conditions that must be met before we can use the second derivative test. The first condition is that both the first derivative and the second derivative must exist at the critical point we wish to test. Assuming they do, then the first derivative must evaluate to zero, while the second derivative must not evaluate to zero. In other words, for a critical point that occurs at x = c, the statements ƒ′(c) = 0 and ƒ′′(c) ≠ 0 must be true. If any these conditions cannot be met, then we have to revert to plan B, which usually means using the first derivative test to determine the nature of the critical point.
Let's look at an example. We will attempt to use the second derivative test to identify the local maxima and minima of the function ƒ(x) = x 4 - 8x 2. Since this is a polynomial function, we know it will be "well behaved". We'll start by finding the function's critical points, which means we need to find the roots of the first derivative function. Applying the basic rules of differentiation, we get:
ƒ′(x) = 4x 3 - 16x
Now we need to solve the equation:
4x 3 - 16x = 0
We can immediately factor out the term 4x:
4x (x 2 - 4) = 0
This gives us possible values for x of -2, 0 and 2. We must now plug these values into the second derivative, which we find by differentiating the first derivative. Applying the basic rules of differentiation, we get:
ƒ′′(x) = 12x 2 - 16
Plugging the x values of our critical points into the second derivative function, we get:
ƒ′′(-2) = (12)(-2 2) - 16 = 32
ƒ′′(0) = (12)(0 2) - 16 = -16
ƒ′′(2) = (12)(2 2) - 16 = 32
Applying the second derivative test, we find that function ƒ(x) = x 4 - 8x 2 has a local minimum at x = -2 (because the second derivative here is positive), a local maximum at x = 0 (the second derivative is negative), and a second local minimum at x = 2 (the second derivative is positive). We can find the actual function values at these points by plugging the x values into the original function:
ƒ(-2) = -2 4 - (8)(-2 2) = 16 - 32 = -16
ƒ(0) = 0 4 - (8)(0 2) = 0 - 0 = 0
ƒ(2) = 2 4 - (8)(2 2) = 16 - 32 = -16
So, on the graph of our function we will have local minima at coordinates (-2, -16) and (2, -16), and a local maximum at (0, 0). We present below the graph of the function ƒ(x) = x 4 - 8x 2, together with those of its first and second derivative. For this function, we can see that the zeros of the second derivative do indeed appear to correspond to inflection points on the graph of the function. This will not always be the case, however. As we saw with the graph of the function ƒ(x) = x 4, the zeroes of the second derivative can also occur at a local maximum or minimum of a function.
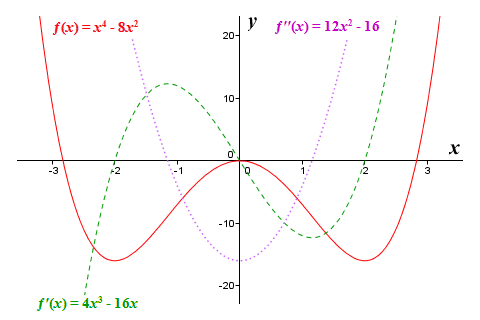
The graphs of ƒ(x) = x 4 - 8x 2, ƒ′(x) = 4x 3 - 16x, and ƒ′′(x) = 12x 2 - 16
Let's look at another example. This time we'll attempt to use the second derivative to classify the critical points of the function ƒ(x) = 3x 5 - 5x 3 + 3. We'll also try to identify the inflection points. Once again, because this is a polynomial function, we know it will be "well behaved", i.e. it will be both continuous and differentiable for all x. First, we'll obtain the x coordinates of the function's critical points by finding the roots of the first derivative function. Applying the basic rules of differentiation, we get:
ƒ′(x) = 15x 4 - 15x 2
Now we need to solve the equation:
15x 4 - 15x 2 = 0
We can immediately factor out the term 15x 2:
15x 2 (x 2 - 1) = 0
This gives us possible values for x of minus one, zero and one. Now we must plug these values into the second derivative, which we find by differentiating the first derivative. Applying the basic rules of differentiation, we get:
ƒ′′(x) = 60x 3 - 30x
Plugging in the x values, we get:
ƒ′′(-1) = (60)(-1 3) - (-30) = -30
ƒ′′(0) = (60)(0 3) - 0 = 0
ƒ′′(1) = (60)(1 3) - 30 = 30
Applying the second derivative test, therefore, we find that function ƒ(x) = 3x 5 - 5x 3 + 3 has a local maximum at x = -1 (because the second derivative is negative here), and a local minimum at x = 1 (where the second derivative is positive). We can find the actual function values at these points by plugging the x values into the original function:
ƒ(-1) = (3)(-1 5) - (5)(-1 3) + 3 = -3 - (-5) + 3 = 5
ƒ(1) = (3)(1 5) - (5)(1 3) + 3 = 3 - 5 + 3 = 1
Since the second derivative at x = 0 evaluates to zero, the second derivative test is inconclusive for this particular critical point. We can't say whether it is a local maximum, a local minimum, or an inflection point, and must instead fall back on the first derivative test to determine its nature. We have already obtained both the first derivative function and a list of the function's critical points. We just need to find the sign of the first derivative immediately to either side of x = 0. First, we select an arbitrary value between minus one and zero (the x coordinates of the first two critical points) and plug it into the first derivative function. We'll use minus zero-point-five (-0.5), which will give us:
ƒ′(-0.5) = (15)(-0.5 4) - (15)(-0.5 2) = -2.8125
So, the first derivative function returns a negative value immediately to the left of x = 0. Now we select an arbitrary value between zero and one (the x coordinates of the last two critical points) and plug it into the first derivative function. We'll use zero-point-five (0.5), which will give us:
ƒ′(0.5) = (15)(0.5 4) - (15)(0.5 2) = -2.8125
So, the first derivative function also returns a negative value immediately to the right of x = 0. The first derivative test therefore tells us that the critical point at x = 0 is neither a local maximum nor a local minimum. But is it an inflection point? Remember the inflection point theorem we outlined above. It tells us that, if we have a point on the graph of a function where the first derivative exists and the second derivative changes sign, then the point must be an inflection point. We know that the first derivative exists at x = 0. We just need to check whether the second derivative changes sign there. We'll start by finding the zeros of the second derivative function, since it is only at these points that the sign of the second derivative can actually change. To do this we solve the equation:
60x 3 - 30x = 0
We can immediately factor out the term 30x:
30x (2x 2 - 1) = 0
This gives us possible values for x of -0.707, 0 and 0.707. The second derivative returns a value of zero at x = 0, which means it could certainly have a different sign on either side of this point, but does it? We can find out by selecting appropriate values of x to the left and right of x = 0 and plugging them into the second derivative function. We'll use values of minus zero-point-five and zero-point-five. This will give us the following results:
ƒ′′(-0.5) = (60)(-0.5 3) - (30)(-0.5) = -7.5 + 15 = 7.5
ƒ′′(0.5) = (60)(0.5 3) - (30)(0.5) = 7.5 - 15 = -7.5
So the second derivative does indeed change sign at x = 0, and must therefore be an inflection point. Testing the values returned by the second derivative to either side of each of its other two critical points will confirm that they too correspond to inflection points on the graph of the original function. You can see the relationships between the graph of the function ƒ(x) = 3x 5 - 5x 3 + 3 and those of its first and second derivatives in the illustration below.
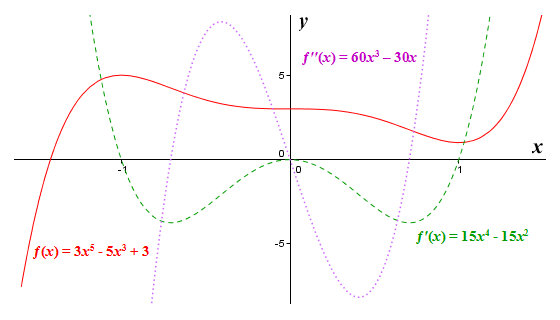
The graphs of ƒ(x) = 3x 5 - 5x 3 + 3, ƒ′(x) = 15x 4 - 15x 2, and ƒ′′(x) = 60x 3 – 30x